Data analysis can feel overwhelming. You’ve got spreadsheets full of numbers, questions that need answers, and pressure to make the right call. But here’s what most people don’t realize: picking the right statistical test is half the battle.
A Z test calculator is one of the most useful tools for analyzing data, but only when you use it at the right time. Use it incorrectly, and you’ll get misleading results. Use it correctly, and you’ll make confident, data-backed decisions.
This guide walks you through exactly when to reach for a Z test calculator. I’ll show you the specific situations where it works best, when to avoid it, and how to know you’re making the right choice. No statistics degree required.
Understanding the Z Test: A Quick Refresher
Before we talk about when to use a Z test, let’s cover what it does.
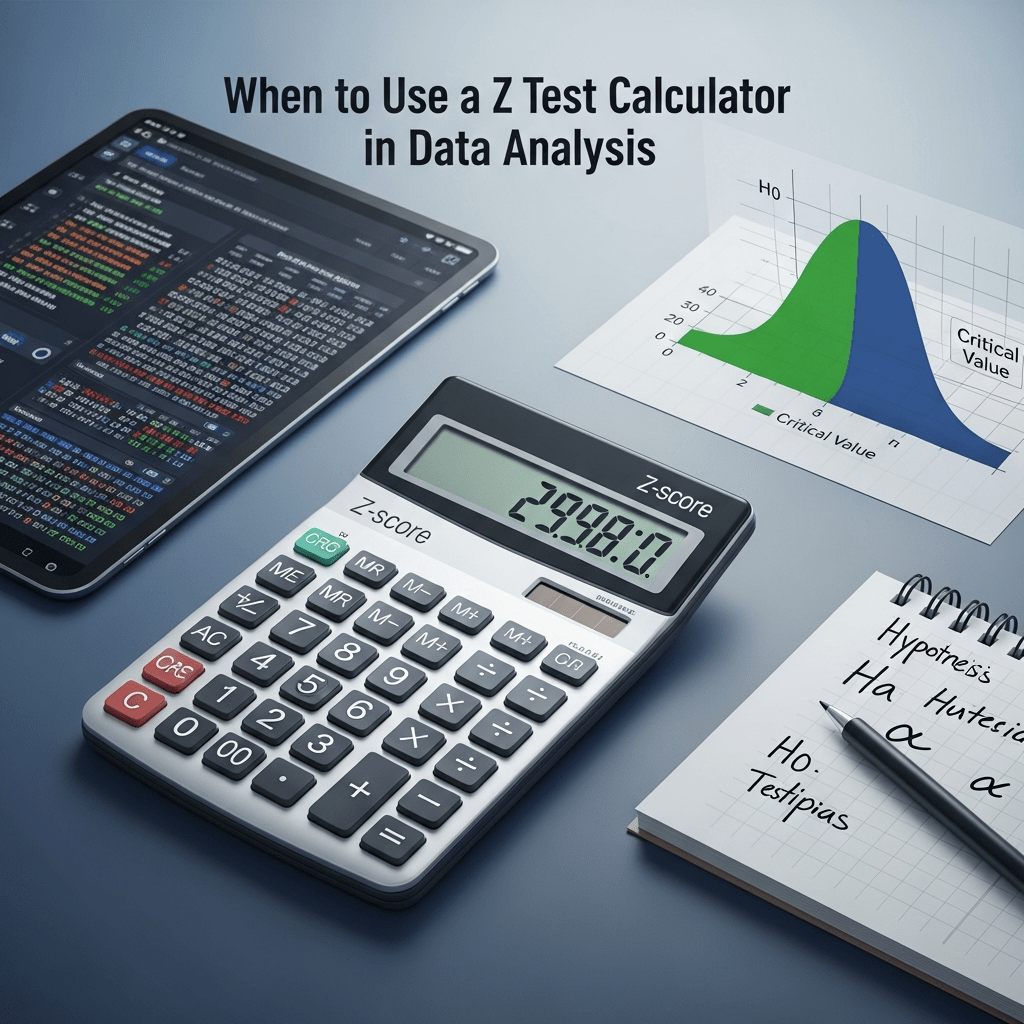
A Z test compares data to see if differences are meaningful or just random noise. Think of it as your BS detector for data. It tells you whether that sales increase, conversion bump, or performance change is real or just chance.
The test works by calculating how far your sample data sits from what you’d expect. If it’s far enough away, you’ve found something significant. If not, you’re probably looking at normal variation.
Here’s the key: Z tests work well in certain conditions but fail miserably in others. Knowing the difference separates good analysis from garbage.
The Five Critical Conditions for Using a Z Test
Not every dataset deserves a Z test. You need to check five conditions before pulling out that calculator.
1. You Have a Large Sample Size
This is the big one. Z tests need at least 30 data points to give reliable results. Why 30? Because that’s when your data starts behaving predictably according to the central limit theorem.
With fewer than 30 points, your results get shaky. The test assumes your data follows a normal distribution, and small samples rarely do that cleanly. If you’re working with 15 customers, 20 survey responses, or 25 website visitors, stop. Use a t-test instead.
Example: You’re analyzing customer satisfaction scores. You’ve got responses from 500 customers. That’s plenty for a Z test. But if you’re looking at a pilot program with only 18 participants, you need a different approach.
2. Your Data Follows a Normal Distribution
Z tests assume your data clusters around an average in that classic bell curve shape. Most values sit near the middle, with fewer values at the extremes.
How do you check? Plot your data in a histogram. Does it look roughly bell-shaped? If it’s heavily skewed (bunched up on one side) or has weird spikes, the Z test might not work well.
Real-world check: Income data usually isn’t normally distributed because a few high earners skew everything. Test scores from a large class? Usually pretty normal. Website session durations? Often skewed because most visits are short, with a few really long ones.
3. You Know the Population Standard Deviation
This one trips people up. The classic Z test requires knowing the standard deviation for your entire population, not just your sample.
In practice, this is rare. You usually don’t have data for everyone, just a sample. That’s why many modern “Z tests” are technically using estimates, or why people switch to t-tests.
However, if you’re in quality control with years of production data, or you’re comparing against established industry benchmarks, you might actually know this number.
4. Your Samples Are Independent
Each data point needs to be independent. One measurement can’t influence another. If you’re testing the same people twice, or your data points are connected somehow, the Z test assumptions break down.
Bad example: Testing people’s performance before and after training. These are paired measurements from the same individuals. You’d need a paired test, not a standard Z test.
Good example: Comparing purchase amounts from customers who saw Ad A versus customers who saw Ad B. These are different people making independent decisions.
5. You’re Testing the Right Type of Question
Z tests work for specific types of comparisons:
- Comparing a sample mean to a known population mean
- Comparing two sample means
- Comparing proportions (like conversion rates or success rates)
They don’t work for everything. Can’t use them to find relationships between multiple variables, predict future values, or analyze categorical data relationships.
Common Scenarios Where Z Tests Excel
Now that you know the requirements, let’s look at situations where Z tests are perfect.
A/B Testing for Conversion Rates
You’re testing two versions of a landing page. Version A converts at 4.2%, version B at 4.8%. You’ve got 2,000 visitors on each version. This is Z test territory.
Your sample is large (check), the groups are independent (check), and you’re comparing proportions (check). Run a two-proportion Z test to see if B really performs better or if you’re seeing random variation.
Quality Control in Manufacturing
Your factory produces bolts that should measure 10mm in diameter. You’ve got years of data showing the standard deviation is 0.15mm. You sample 50 bolts from today’s production and get an average of 10.08mm.
Is production running correctly, or is something off? Z test tells you. You’ve got a large sample, known population parameters, and you’re comparing a sample mean to a population mean.
Comparing Survey Results to Benchmarks
You run a customer satisfaction survey and get an average score of 7.2 out of 10 from 300 customers. Industry research shows the average is 7.5 with a known standard deviation.
Are you underperforming, or is this difference within normal range? Z test gives you the answer. Large sample, known benchmark, clear comparison.
Testing Marketing Campaign Performance
Your email campaign got a 15% click-through rate with 1,500 recipients. Your historical average is 12%. Did this campaign actually perform better, or did you get lucky?
If you have enough historical data to establish a known standard deviation, a Z test tells you whether this is a real improvement worth repeating.
Pharmaceutical Trials (Large Scale)
You’re testing if a new drug lowers blood pressure more than a placebo. You’ve got 500 patients in each group, independent assignment, and you’re comparing mean blood pressure changes.
This is a textbook Z test scenario (or its close cousin, since you might not know the population standard deviation and would use a t-test instead).
When NOT to Use a Z Test
Just as important as knowing when to use a Z test is knowing when to avoid it. Here are the red flags.
Small Sample Sizes
Got fewer than 30 data points? Don’t use a Z test. Switch to a t-test. This isn’t a suggestion, it’s a requirement. Z tests give inaccurate results with small samples because the underlying assumptions fall apart.
The t-test is designed for small samples. It’s more conservative and accounts for the extra uncertainty that comes with limited data.
Unknown Population Parameters
If you don’t know your population standard deviation and you’re using sample estimates instead, technically you should use a t-test. Many online calculators blur this line, but strict statisticians will tell you a true Z test requires known population parameters.
Paired or Matched Data
Testing the same group before and after an intervention? That’s paired data. Use a paired t-test or paired Z test (yes, there’s a paired version), not a standard Z test.
Example: Measuring employee productivity before and after a training program using the same employees. These measurements are linked.
Non-Normal Distributions
If your data is heavily skewed or has a weird shape, the Z test might give misleading results. Consider:
- Transforming your data (like taking logarithms)
- Using non-parametric tests that don’t assume normality
- Collecting more data to see if it normalizes
Multiple Comparisons
Testing more than two groups at once? Don’t run multiple Z tests. Use ANOVA instead. Running multiple tests increases your chance of false positives (finding significance by accident).
Example: You’ve got three ad campaigns and want to compare them. Running three separate Z tests (A vs B, A vs C, B vs C) inflates your error rate.
Categorical Relationships
Want to know if gender relates to product preference? That’s categorical data calling for a chi-square test, not a Z test.
Choosing Between Z Test and T Test
This is the most common dilemma. Both tests compare means, so how do you pick?
Use a Z Test When:
- Sample size is 30 or more
- You know the population standard deviation
- Your data is normally distributed
Use a T Test When:
- Sample size is under 30
- You don’t know the population standard deviation
- You’re working with small datasets
Here’s the practical reality: with large samples (over 100), Z tests and t-tests give nearly identical results. The bigger your sample, the less the choice matters. That’s why some statisticians are relaxed about the distinction with big datasets.
With small samples (under 30), the choice matters a lot. Always use a t-test for small samples.
Step-by-Step: Deciding Which Test to Use
Here’s a simple decision tree to follow:
Step 1: How many groups are you comparing?
- One sample vs. a known value: Continue to Step 2
- Two groups: Continue to Step 2
- More than two groups: Use ANOVA, not a Z test
If you’re just counting frequencies or tallying responses, you might not need a statistical test at all a simple Tally calculator might be all you need.
Step 2: What’s your sample size?
- Under 30: Use a t-test
- 30 or more: Continue to Step 3
Step 3: Do you know the population standard deviation?
- Yes: Use a Z test
- No: Use a t-test (or Z test with large samples, since results converge)
Step 4: Is your data normally distributed?
- Yes: Proceed with your chosen test
- No: Consider transforming data or using non-parametric alternatives
Step 5: Are your groups independent?
- Yes: Proceed
- No: Use paired tests instead
Real-World Examples: Making the Right Choice
Let’s walk through some scenarios to see decision-making in action.
Example 1: Website Redesign
Situation: You redesigned your checkout page. You have 800 transactions on the old design (3.5% conversion) and 800 on the new design (4.1% conversion).
Analysis: Sample size is large (800 each). Groups are independent (different visitors). You’re comparing proportions. This calls for a two-proportion Z test.
Decision: Use Z test calculator.
Example 2: Employee Training Program
Situation: You trained 12 employees and want to measure productivity improvement. You have before and after scores for each person.
Analysis: Sample size is small (12). Data is paired (same people measured twice).
Decision: Use paired t-test, not Z test.
Example 3: Product Quality Check
Situation: You sampled 25 products from a new supplier. You want to compare weight against your specifications.
Analysis: Sample size is small (25, under 30).
Decision: Use t-test, not Z test.
Example 4: Survey Analysis
Situation: You surveyed 450 customers about brand perception. You want to compare your score against the industry average.
Analysis: Large sample (450). Independent responses. Normal survey data.
Decision: Use Z test if you have industry standard deviation, otherwise use t-test.
Common Mistakes to Avoid
Even when you pick the right test, you can still mess things up. Watch for these errors.
Ignoring Sample Size Requirements
This is the most common mistake. People run Z tests on 15 data points and wonder why results seem off. Small samples need t-tests, period.
Assuming All Data Is Normal
Just because you want to use a Z test doesn’t mean your data cooperates. Always check distribution before testing. A histogram takes 30 seconds and saves you from false conclusions.
Testing Multiple Times
Found a non-significant result and want to collect more data? Fine. But don’t keep testing every few data points until you get significance. That’s p-hacking and it invalidates your results.
Decide your sample size before you start, collect that much data, and test once.
Confusing Practical and Statistical Significance
A Z test might show your change is statistically significant (p < 0.05), but is a 0.1% improvement worth the effort? Statistical significance doesn’t equal real-world importance.
Always ask: does this finding matter for my actual goals?
Using the Wrong Test Type
One-tailed vs. two-tailed tests matter. Use one-tailed when you only care about change in one direction (is B better than A?). Use two-tailed when you care about any difference (is B different from A?).
Most situations call for two-tailed tests unless you have a strong directional hypothesis.
Making Better Testing Decisions
Choosing the right test isn’t just about following rules. It’s about understanding your data and your question.
Ask Better Questions
Before reaching for any statistical test, clarify what you’re asking. “Did our campaign work?” is vague. “Did our campaign increase click-through rate compared to our baseline?” is specific and testable.
Know Your Data
Spend time exploring before testing. Look at distributions, check for outliers, understand what you’re working with. Five minutes of exploration prevents hours of wasted analysis.
Consider Context
Statistics give you probabilities, not certainties. A p-value of 0.04 means there’s a 4% chance your result is random. In medical research, that might not be enough. In marketing tests, it might be fine.
Your field, stakes, and consequences matter when interpreting results.
Document Your Decisions
Write down why you chose a particular test. This helps you learn and helps others review your work. “Used Z test because n > 30 and comparing sample mean to known benchmark” is clear and defensible.
Frequently Asked Questions
Can I use a Z test with a sample size of 25?
No. Z tests need at least 30 data points. With 25, use a t-test instead. The t-test is designed for smaller samples and gives more reliable results when you have limited data.
What if my data isn’t perfectly normal?
Slight deviations from normality are okay, especially with larger samples. If your data is seriously skewed or has multiple peaks, consider data transformation or non-parametric alternatives like the Mann-Whitney U test.
Do I always need to know population standard deviation?
Technically yes, for a true Z test. In practice, with large samples (over 100), you can use sample standard deviation and results will be nearly identical to a t-test. Many calculators handle this automatically.
What’s the difference between one-tailed and two-tailed Z tests?
One-tailed tests check if values are greater than (or less than) a benchmark. Two-tailed tests check if values are simply different, regardless of direction. Use two-tailed unless you have specific directional predictions.
Can I use Z tests for comparing three or more groups?
No. Z tests compare one or two groups. For three or more groups, use ANOVA (Analysis of Variance). Running multiple Z tests between pairs increases your chance of false positives.
How do I check if my data is normally distributed?
Create a histogram or use a normal probability plot. For quick checks, look for: symmetric distribution, most data near the mean, fewer values at extremes. Statistical tests like Shapiro-Wilk can also check normality.
What if my Z test shows p = 0.051, just above 0.05?
Don’t obsess over arbitrary cutoffs. A p-value of 0.051 suggests marginal evidence against the null hypothesis. Consider collecting more data, looking at practical significance, and understanding that 0.05 is a convention, not a law of nature.
Should I use Z test or chi-square for proportion comparison?
Both can work for comparing proportions. Z tests are more common for comparing two proportions. Chi-square tests work well for categorical data and can handle more complex scenarios. For simple two-proportion comparisons, Z tests are standard.
Your Next Steps in Data Analysis
Knowing when to use a Z test calculator puts you ahead of most people doing data analysis. You’re not just running calculations blindly. You understand the conditions that make tests valid and the situations where they fail.
Start practicing with your own data. Pick a simple question, check if it meets Z test conditions, and run the analysis. The more you practice, the more intuitive these decisions become.
Remember that statistical tests are tools, not magic. They help you make informed decisions, but they don’t make decisions for you. Combine statistical evidence with domain knowledge, practical considerations, and common sense.
The goal isn’t to become a statistics expert. The goal is to use statistical tools appropriately to answer real questions and make better decisions. A Z test calculator is powerful when you know its strengths, limitations, and proper applications.
Ready to analyze your data? Check your conditions, fire up a calculator like ztestcalculator.com, and see what insights you can find. Just make sure you’re using the right tool for the job.

Leave a comment